
Wisconsin Car Accident Statistics
Every year, there are well over 100,000 motor vehicle collisions throughout Wisconsin leaving hundreds dead and thousands injured. We examined six years of crash data from the Department of Transportation to show when, where, how, and who is involved in crashes across the state.
Crashes by Severity and Year
From 2015 through 2019, there was a steady increase in total crashes each year. However, that trend was interrupted in 2020 – an obvious result of the pandemic and ensuing response. In 2020, there were 114,697 motor vehicle collisions in the state of Wisconsin – a 21 percent decrease in crashes from 2019.
| Crash Severity | 2015 | 2016 | 2017 | 2018 | 2019 | 2020 |
|---|---|---|---|---|---|---|
| Fatal Crashes | 513 | 524 | 539 | 517 | 511 | 540 |
| Injury Crashes | 29,845 | 31,066 | 30,614 | 29,959 | 28,791 | 23,747 |
| Property Damage Crashes | 91,255 | 97,461 | 108,717 | 113,736 | 115,986 | 90,410 |
| Total Crashes | 121,613 | 129,051 | 139,870 | 144,212 | 145,288 | 115,694 |
Interestingly, despite the dramatic decrease in total crashes, fatal crashes actually saw a slight increase. This is consistent with what traffic safety organizations across the country have seen. The consensus has been that while overall crashes decreased in 2020, dangerous behaviors such as speeding and impaired driving continued.
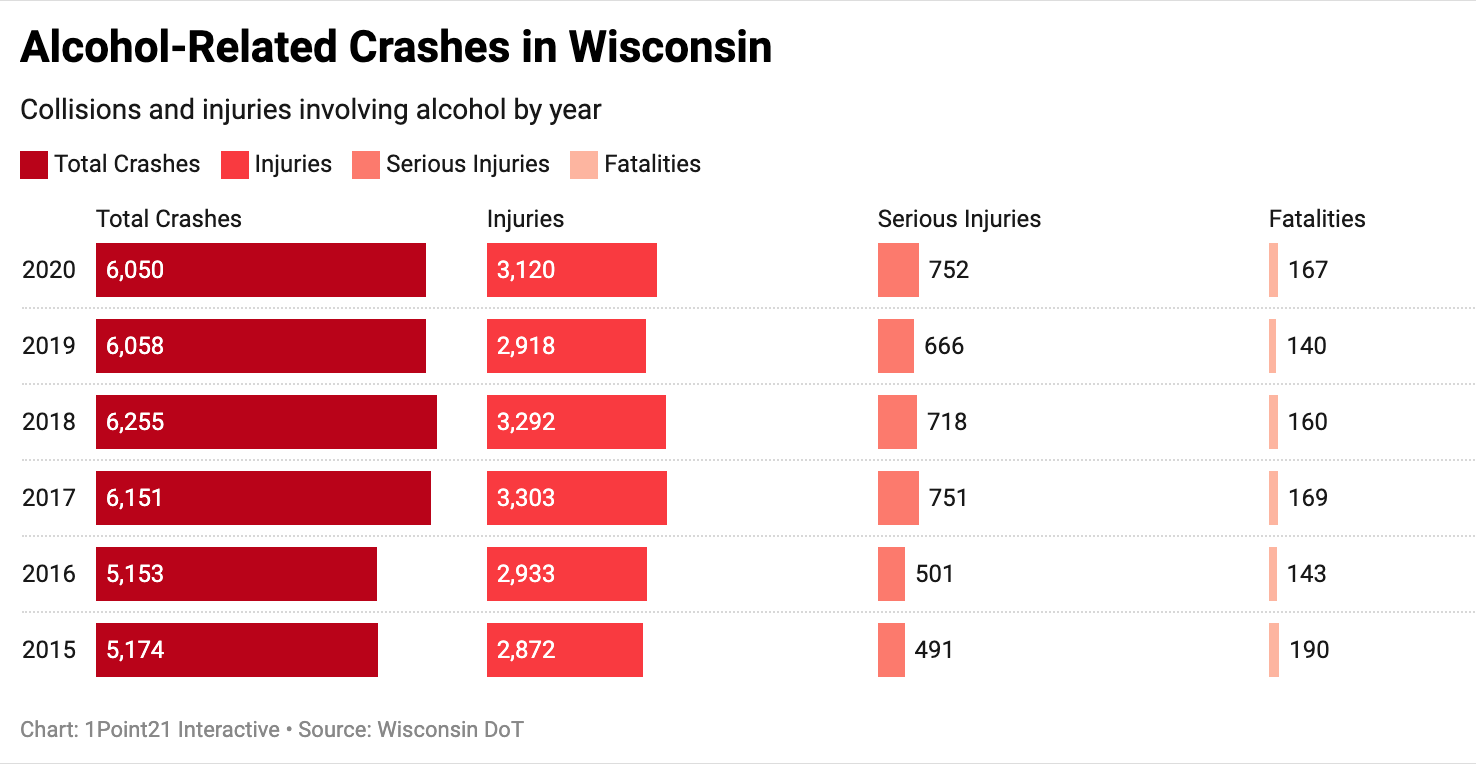
Wisconsin Drug and Alcohol-Related Collisions by Year and Severity
As previously mentioned, we also see an increase in deaths and injuries involving drugs and alcohol in 2020. Overall crashes involving both impairments actually increased as well.
| Alcohol-Related | 2015 | 2016 | 2017 | 2018 | 2019 | 2020 |
|---|---|---|---|---|---|---|
| Alcohol-Related Crashes | 5,174 | 5,153 | 6,151 | 6,255 | 6,058 | 6,050 |
| Alcohol-Related Fatalities | 190 | 143 | 169 | 160 | 140 | 167 |
| Alcohol-Related Injuries | 2,872 | 2,933 | 3,303 | 3,292 | 2,918 | 3,120 |
| Alcohol-Related Serious Injuries | 491 | 501 | 751 | 718 | 666 | 752 |
In 2020, drug-related crashes were at a six-year high – up 66 percent over 2015.
| Drug-Related | 2015 | 2016 | 2017 | 2018 | 2019 | 2020 |
|---|---|---|---|---|---|---|
| Drug-Related Crashes | 815 | 762 | 1,746 | 1,724 | 1,749 | 2,250 |
| Drug-Related Fatalities | 149 | 118 | 72 | 59 | 59 | 80 |
| Drug-Related Injuries | 582 | 475 | 1,187 | 1,198 | 1,099 | 1,412 |
| Drug-Related Serious Injuries | 107 | 87 | 243 | 246 | 233 | 294 |
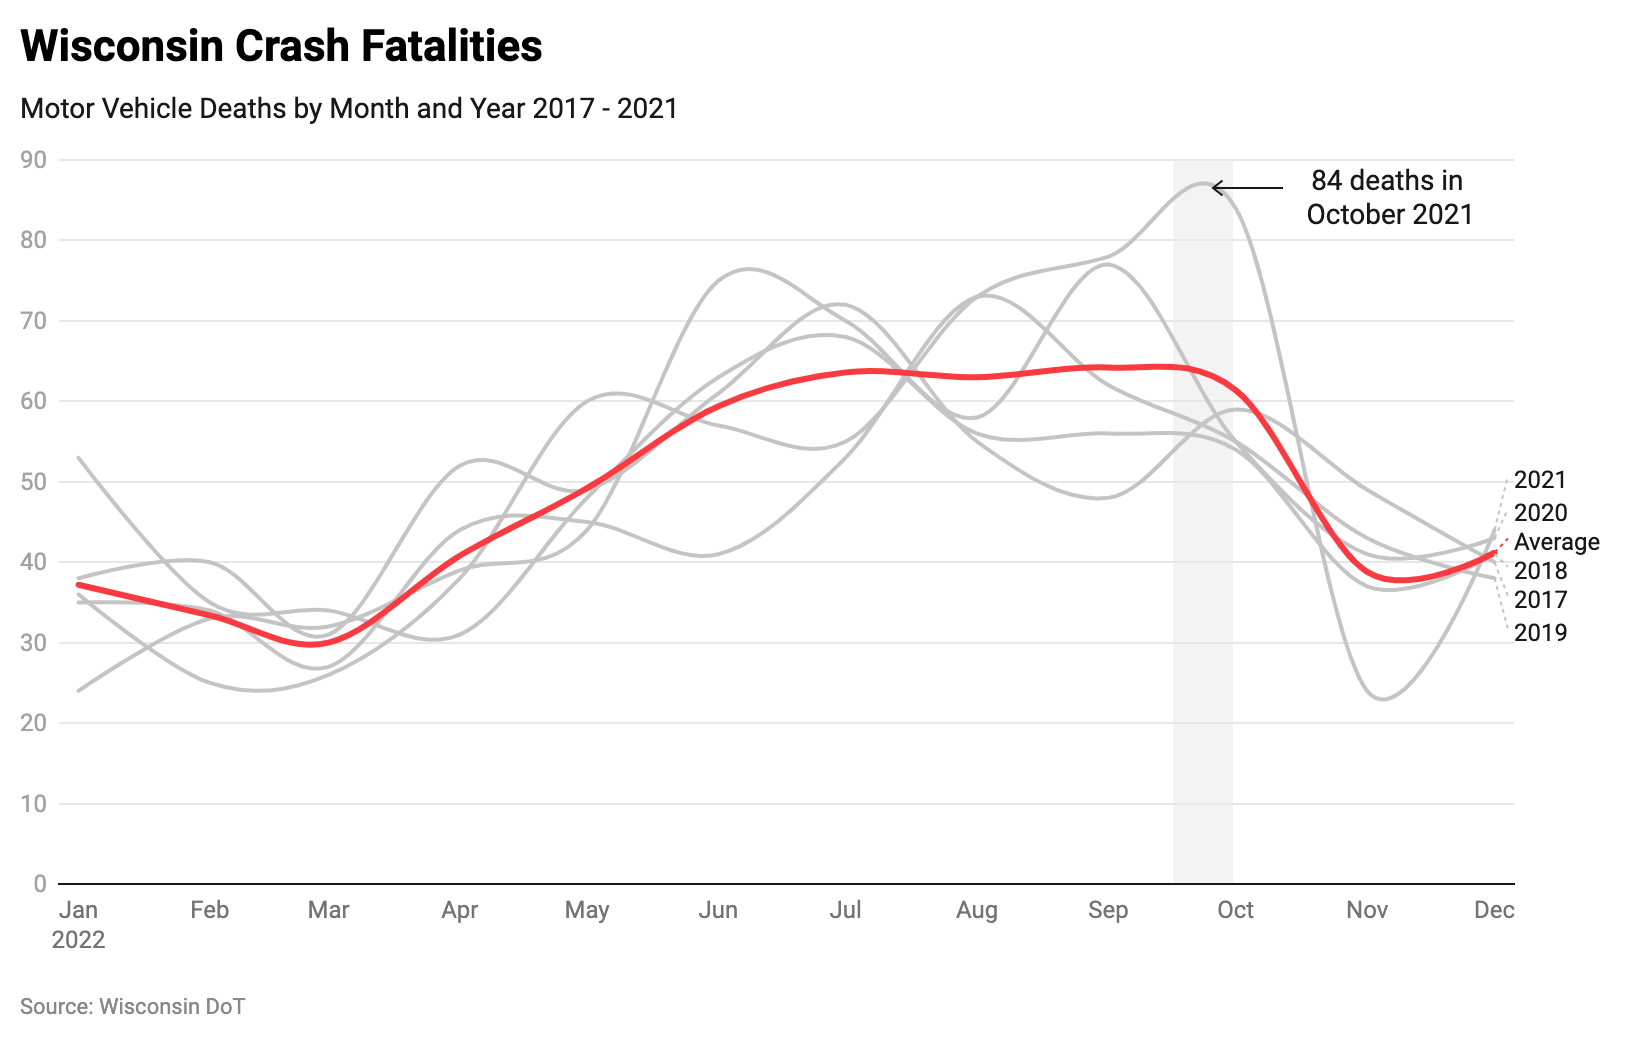
Motor Vehicle Fatalities by Month
In Wisconsin, motor vehicle fatalities typically peak in the summer months during June, July, and August. Interestingly, preliminary 2021 data shows a sharp spike in fatalities in August and October with 73 and 84 fatalities, respectively.
| Month | 2017 | 2018 | 2019 | 2020 | 2021* |
|---|---|---|---|---|---|
| January | 38 | 53 | 35 | 24 | 36 |
| February | 40 | 35 | 34 | 33 | 25 |
| March | 31 | 34 | 27 | 32 | 26 |
| April | 52 | 31 | 44 | 39 | 38 |
| May | 49 | 48 | 45 | 44 | 60 |
| June | 61 | 63 | 41 | 75 | 57 |
| July | 72 | 68 | 53 | 70 | 55 |
| August | 55 | 56 | 73 | 58 | 73 |
| September | 48 | 56 | 62 | 77 | 78 |
| October | 59 | 54 | 55 | 55 | 84 |
| November | 49 | 37 | 43 | 41 | 24 |
| December | 40 | 41 | 38 | 43 | 44 |
*2021 data is not finalized as of this publishing date
Wisconsin Crashes by Road Type
The majority of collisions take place in urban settings, with 38 percent of crashes occurring on urban city streets and 14 percent on urban highways. Conversely, 17 percent of crashes occurred on rural state highways and only 4 percent on rural streets.
| Road Type | 2015 | 2016 | 2017 | 2018 | 2019 | 2020 |
|---|---|---|---|---|---|---|
| Urban city street crashes | 43,332 | 48,008 | 55,064 | 56,801 | 57,601 | 44,516 |
| Rural city street crashes | 4,083 | 4,219 | 7,138 | 7,111 | 7,129 | 5,513 |
| Town road crashes | 8,751 | 8,988 | 13,216 | 11,363 | 10,922 | 9,551 |
| County highway crashes | 12,551 | 13,847 | 12,048 | 13,628 | 12,992 | 11,439 |
| Urban state highway crashes | 19,446 | 19,019 | 17,159 | 19,068 | 19,500 | 14,792 |
| Rural state highway crashes | 23,803 | 25,007 | 23,206 | 23,323 | 23,455 | 18,767 |
| Urban interstate crashes | 5,366 | 5,223 | 6,431 | 6,762 | 7,197 | 5,273 |
| Rural interstate crashes | 4,263 | 4,740 | 5,608 | 6,156 | 5,492 | 4,846 |
Wisconsin Motor Vehicle Collisions By Year and County
At the county level, Milwaukee County has – by far -the highest number of collisions annually, with 24,000 in 2020 alone. Milwaukee County is followed by Dane (7,970), Waukesha (6,638), Racine (4,171), and Kenosha (3,375) counties to round out the top five.
| County | 2015 | 2016 | 2017 | 2018 | 2019 | 2020 |
|---|---|---|---|---|---|---|
| Adams | 392 | 402 | 483 | 476 | 436 | 371 |
| Ashland | 242 | 290 | 359 | 316 | 331 | 244 |
| Barron | 677 | 715 | 876 | 873 | 761 | 708 |
| Bayfield | 346 | 347 | 401 | 362 | 321 | 277 |
| Brown | 3,739 | 3,862 | 4,173 | 3,986 | 4,350 | 2,886 |
| Buffalo | 223 | 260 | 284 | 256 | 251 | 250 |
| Burnett | 223 | 253 | 312 | 308 | 292 | 254 |
| Calumet | 809 | 827 | 914 | 847 | 850 | 710 |
| Chippewa | 1,164 | 1,308 | 1,427 | 1,397 | 1,412 | 1,172 |
| Clark | 510 | 574 | 552 | 631 | 637 | 555 |
| Columbia | 1,461 | 1,400 | 1,495 | 1,504 | 1,472 | 1,379 |
| Crawford | 330 | 343 | 373 | 338 | 321 | 273 |
| Dane | 11,030 | 11,825 | 12,130 | 12,418 | 11,892 | 7,970 |
| Dodge | 1,514 | 1,616 | 1,581 | 1,756 | 1,722 | 1,539 |
| Door | 869 | 895 | 907 | 873 | 930 | 698 |
| Douglas | 701 | 722 | 858 | 867 | 960 | 672 |
| Dunn | 873 | 826 | 870 | 812 | 915 | 637 |
| Eau Claire | 2,238 | 2,341 | 2,870 | 2,899 | 3,269 | 1,950 |
| Florence | 113 | 104 | 136 | 114 | 95 | 82 |
| Fond Du Lac | 2,439 | 2,328 | 2,710 | 2,786 | 2,775 | 2,326 |
| Forest | 183 | 190 | 179 | 203 | 213 | 174 |
| Grant | 1,138 | 1,276 | 1,313 | 1,326 | 1,349 | 1,191 |
| Green | 893 | 816 | 752 | 848 | 901 | 753 |
| Green Lake | 523 | 459 | 469 | 454 | 441 | 338 |
| Iowa | 377 | 427 | 481 | 514 | 566 | 468 |
| Iron | 90 | 69 | 81 | 84 | 112 | 89 |
| Jackson | 541 | 607 | 612 | 644 | 611 | 506 |
| Jefferson | 1,482 | 1,715 | 1,848 | 1,962 | 1,901 | 1,720 |
| Juneau | 731 | 775 | 828 | 889 | 865 | 653 |
| Kenosha | 3,625 | 3,881 | 4,264 | 4,266 | 4,474 | 3,735 |
| Kewaunee | 448 | 525 | 505 | 450 | 439 | 365 |
| La Crosse | 3,075 | 3,164 | 3,532 | 3,776 | 3,882 | 2,585 |
| Lafayette | 524 | 544 | 559 | 597 | 575 | 464 |
| Langlade | 381 | 409 | 532 | 568 | 455 | 440 |
| Lincoln | 680 | 681 | 866 | 852 | 784 | 664 |
| Manitowoc | 1,939 | 2,114 | 2,377 | 2,189 | 2,329 | 1,957 |
| Marathon | 2,735 | 3,062 | 3,349 | 3,352 | 3,470 | 2,492 |
| Marinette | 792 | 796 | 933 | 980 | 997 | 856 |
| Marquette | 394 | 381 | 430 | 423 | 396 | 302 |
| Menominee | 47 | 36 | 36 | 27 | 27 | 18 |
| Milwaukee | 24,170 | 24,938 | 26,494 | 28,478 | 29,594 | 24,376 |
| Monroe | 1,159 | 1,216 | 1,385 | 1,526 | 1,426 | 1,197 |
| Oconto | 388 | 419 | 996 | 866 | 651 | 504 |
| Oneida | 823 | 1,004 | 1,026 | 1,007 | 972 | 810 |
| Outagamie | 3,853 | 4,108 | 4,276 | 4,344 | 4,692 | 3,277 |
| Ozaukee | 1,541 | 1,623 | 1,697 | 1,846 | 1,843 | 1,577 |
| Pepin | 142 | 142 | 134 | 125 | 105 | 103 |
| Pierce | 478 | 484 | 554 | 589 | 619 | 473 |
| Polk | 609 | 654 | 706 | 719 | 596 | 569 |
| Portage | 1,262 | 1,376 | 1,570 | 1,530 | 1,626 | 1,182 |
| Price | 169 | 193 | 192 | 205 | 188 | 190 |
| Racine | 4,137 | 4,145 | 4,867 | 5,356 | 5,172 | 4,171 |
| Richland | 474 | 456 | 480 | 469 | 461 | 344 |
| Rock | 3,428 | 3,888 | 4,205 | 4,558 | 4,346 | 3,636 |
| Rusk | 216 | 252 | 231 | 229 | 205 | 192 |
| St. Croix | 1,957 | 2,075 | 2,295 | 2,436 | 2,523 | 2,258 |
| Sauk | 1,653 | 1,628 | 1,927 | 1,978 | 1,851 | 1,487 |
| Sawyer | 227 | 245 | 314 | 336 | 305 | 305 |
| Shawano | 1,269 | 1,272 | 1,499 | 1,481 | 1,547 | 1,305 |
| Sheboygan | 1,846 | 2,592 | 2,867 | 2,905 | 3,028 | 2,609 |
| Taylor | 415 | 409 | 461 | 445 | 391 | 392 |
| Trempealeau | 474 | 541 | 484 | 559 | 582 | 498 |
| Vernon | 803 | 814 | 829 | 955 | 824 | 478 |
| Vilas | 484 | 575 | 557 | 526 | 543 | 469 |
| Walworth | 1,710 | 1,929 | 2,181 | 2,322 | 2,332 | 2,040 |
| Washburn | 321 | 364 | 390 | 386 | 356 | 300 |
| Washington | 3,093 | 3,310 | 3,547 | 3,680 | 3,548 | 3,041 |
| Waukesha | 7,308 | 8,061 | 8,420 | 8,589 | 8,681 | 6,638 |
| Waupaca | 1,317 | 1,359 | 1,448 | 1,361 | 1,251 | 782 |
| Waushara | 598 | 732 | 662 | 582 | 585 | 480 |
| Winnebago | 3,617 | 3,877 | 4,218 | 4,208 | 4,216 | 3,216 |
| Wood | 1,183 | 1,205 | 1,301 | 1,393 | 1,450 | 1,075 |
How to Use this Information
A popular saying is that “knowledge is power”. This specifically applies to motor vehicle and road safety. Making yourself aware of the state of the roads around and when, where, and how collisions occur can help you make decisions to improve your overall safety. Unfortunately, there is no way to completely eliminate the risk of collision, even if you take every precaution possible. As motorists, we are forced to rely on others to make good choices and operate their vehicles in a manner that keeps others safe. When collisions do occur, a Milwaukee car accident attorney may be able to help you recover.