
Milwaukee Car Accident Statistics
Every year, thousands of people are involved in car accidents in the Milwaukee area. In fact, from 2008 through 2022, over 202,000 collisions occurred that either caused significant property damage or killed or injured at least one person.
At Mingo & Yankala, S.C., we have seen first hand the damage that a serious car accident can cause. In fact, most often ‘car accidents’ are not accidents at all, but the result of the carelessness of a driver or other entity. For this reason, we decided to examine collision data and provide insights, analysis, and statistics about crashes and car accidents in Milwaukee.
Overall, reportable motor vehicle collisions have steadily increased in Milwaukee since 2008, peaking in 2019 with 17,649. In a trend that aligns with findings from other areas, collisions remained high in 2020 despite the COVID-19 response’s impact on traffic – dropping to 15,838, still the fourth-highest number since 2008.
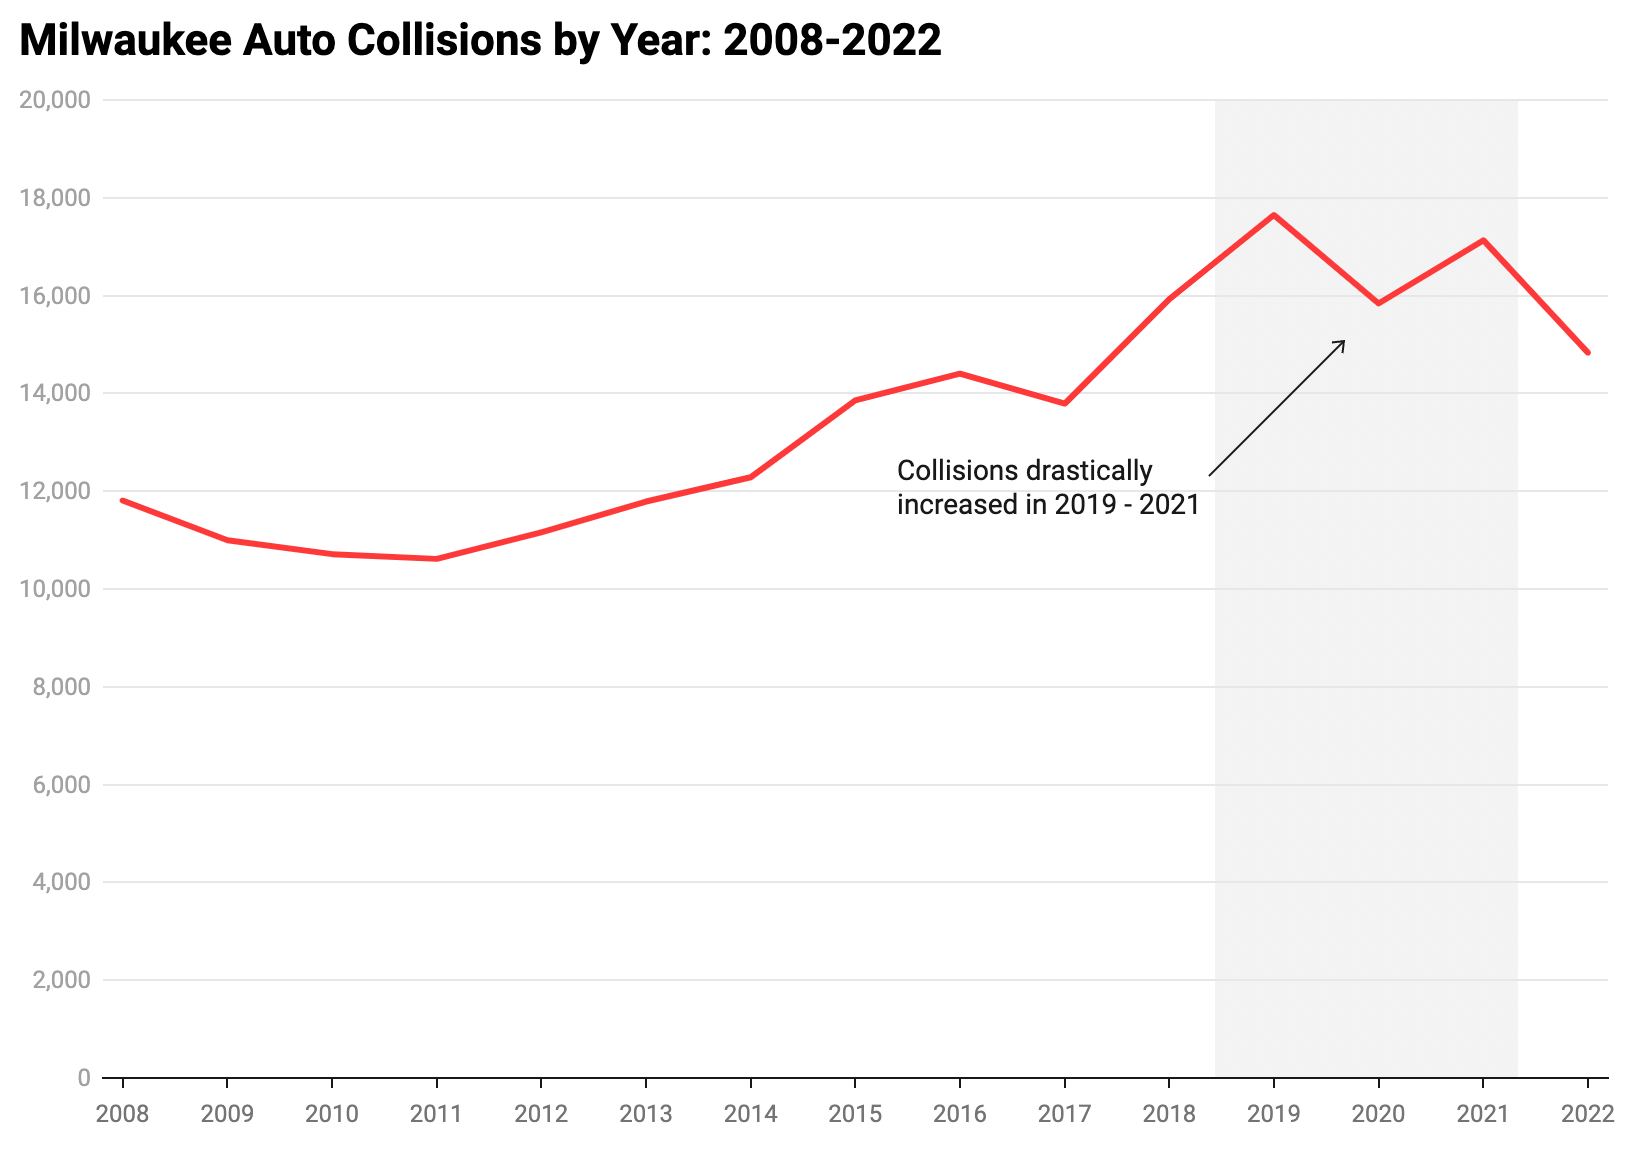
Milwaukee, Wisconsin Car Accidents by Year
The data shows that collisions did decrease considerably in 2022 with 14,832, the first time there were less than 15,000 since 2017.
| Year | Collisions |
|---|---|
| 2008 | 11810 |
| 2009 | 10996 |
| 2010 | 10713 |
| 2011 | 10616 |
| 2012 | 11159 |
| 2013 | 11789 |
| 2014 | 12286 |
| 2015 | 13857 |
| 2016 | 14405 |
| 2017 | 13792 |
| 2018 | 15930 |
| 2019 | 17649 |
| 2020 | 15838 |
| 2021 | 17131 |
| 2022 | 14832 |
While the table above includes all reportable crashes, motor vehicle fatalities followed a slightly different pattern. In 2020, 101 people were killed in motor vehicle crashes in Milwaukee county, after just 74 in 2018. By 2022, deaths had increased to 111.
Collisions by Month of Year
In many places throughout the country, collisions peak in the summer – during a time of year known as the 100 deadly days of summer. However, in Milwaukee, collisions peak in winter and in October.
| Month | Collisions |
|---|---|
| January | 18,233 |
| February | 17,866 |
| March | 16,356 |
| April | 15,789 |
| May | 17,570 |
| June | 17,206 |
| July | 17,225 |
| August | 17,216 |
| September | 17,351 |
| October | 18,155 |
| November | 16,847 |
| December | 17,680 |
When do Accident Occur? Crashes by Time of Day
As one might expect, collisions peak between 3 and 6 pm in Milwaukee, a time that typically encompasses the evening or afternoon rush hour. What is surprising, perhaps, is that nearly twice as many crashes occured during period then in the morning commuting hours.

Where Do Car Accidents Occur in Milwaukee?
While a car accident can occur anywhere, certain areas are more prone to them than others. The map below shows all collisions in Milwaukee County from 2018-2022. Each hexagon has a radius of one mile. Darker red colored hexagons indicate a higher volume of crashes.
Interactive Map: All Milwaukee County Crashes
When an address was provided in the data set that included cross streets, the intersection of N 27th Street and W Center Street saw more crashes than any other in Milwaukee, with 420. N 35th Street and W Center Street came in second with 286 crashes, and N Teutonia Avenue and W Willard Avenue in third with 275 collisions.
Top 50 Car Accident Locations in Milwaukee
| Rank | Location | Crashes |
|---|---|---|
| 1 | N 27Th St & W Center St | 420 |
| 2 | N 35Th St & W Center St | 286 |
| 3 | N Teutonia Av & W Villard Av | 275 |
| 4 | N 35Th St & W North Av | 271 |
| 5 | N 27Th St & W Fond Du Lac Av | 257 |
| 6 | N 60Th St & W Silver Spring Dr | 255 |
| 7 | W Capitol Dr & N Sherman Bl | 238 |
| 8 | W Fond Du Lac Av & W Locust St | 233 |
| 9 | W Hampton Av & N Teutonia Av | 229 |
| 10 | N 35Th St & W Capitol Dr | 228 |
| 10 | N 60Th St & W Hampton Av | 228 |
| 12 | N 27Th St & W Burleigh St | 224 |
| 13 | W Center St & N Sherman Bl | 222 |
| 14 | W Center St & W Fond Du Lac Av | 216 |
| 15 | W Locust St & N Martin L King Jr Dr | 212 |
| 16 | W Burleigh St & N Sherman Bl | 211 |
| 17 | S 35Th St & W National Av | 209 |
| 17 | W Fond Du Lac Av & N Sherman Bl | 209 |
| 19 | N 27Th St & W North Av | 208 |
| 19 | N 35Th St & W Lisbon Av | 208 |
| 21 | N 91St St & W Silver Spring Dr | 203 |
| 22 | S Cesar E Chavez Dr & W National Av | 199 |
| 23 | N 27Th St & W Lisbon Av | 198 |
| 23 | W Hampton Av & N Hopkins St | 198 |
| 25 | N 51St Bl & W Hampton Av | 194 |
| 26 | N 60Th St & W Villard Av | 192 |
| 27 | W Hampton Av & N Sherman Bl | 190 |
| 28 | N 27Th St & W Locust St | 186 |
| 29 | N 27Th St & W Capitol Dr | 184 |
| 29 | N 60Th St & W Fond Du Lac Av | 184 |
| 31 | N 35Th St & W Fond Du Lac Av | 183 |
| 31 | N 60Th St & W Good Hope Rd | 183 |
| 33 | N 35Th St & W Locust St | 178 |
| 34 | N 51St Bl & W Capitol Dr | 173 |
| 34 | W Greenfield Av & S Layton Bl | 173 |
| 36 | N 6Th St & W Mc Kinley Av | 171 |
| 36 | S 13Th St & W Layton Av | 171 |
| 38 | N 60Th St & W Capitol Dr | 170 |
| 39 | W Capitol Dr & W Fond Du Lac Av | 168 |
| 40 | N 107Th St & W Good Hope Rd | 165 |
| 40 | N 27Th St & W Vliet St | 165 |
| 42 | N Martin L King Jr Dr & W North Av | 162 |
| 43 | N 35Th St & W Vliet St | 161 |
| 44 | W Locust St & N Sherman Bl | 155 |
| 45 | S 20Th St & W Layton Av | 154 |
| 45 | W Capitol Dr & N Teutonia Av | 154 |
| 47 | N Sherman Bl & W Villard Av | 153 |
| 48 | N 91St St & W Good Hope Rd | 152 |
| 49 | W Center St & N Martin L King Jr Dr | 151 |
| 50 | S 13Th St & W Oklahoma Av | 150 |
Datasource and Methodology
The dataset used in this analysis is based on collisions reported to or responded to by the Milwaukee Police Department from the years 2008 through 2022. Reportable accidents included any collision that results in injury or death to any person, results in total property damage to any one person of more than $1,000, or damage government owned, non-vehicle property to the extent of $200 or more.
Fatality data for Milwaukee County was provided by the Wisconsin Deparment of Transporation. See our analysis of the deadliest roads in Wisconsin or our Wisconsin car accident statistics analysis for more information.